Campaign Manager - INSIGHTS
Venn InsightA Venn Insight allows the user to set a single measure table to define the table at which counts will be displayed, and up to 6 segments, either created on the fly or selected form the existing segment library, to be used in the data visualization to create a classic Venn diagram or grid, giving a fast and clear view of the interactions and patterns that may exist in those segments. SIMPLE ExampleThis example shows a simple 2 segment Venn Insight. MeasureCustomer Table - A table of data containing 100 customers. DimensionsSegment 1 - Customers who are female - Count 60 Segment 2 - Customers aged 25 to 35 - Count 34 Result
Result Breakdown
Creating a Venn InsightOn the Insight View screen, click the New Insight button and select the Venn option from the drop down menu.
This will open the Venn screen:
The following steps are used to create a Venn Insight: Define a MeasureThe Measure is the table of data that the visualization will display counts of. Any segmentation not already resolved to this table will be resolved to here prior to the Venn calculation to create the Venn Insight. On the Venn screen, click on the Measure field to display the data source selection menu.
Drill down by clicking on the required data source options until you locate the table you wish to use:
The
Alternatively use the Search field to find the required table of data. Once located, click on the required table to select it and click the Select button.
This will add the selected table to the Measure field.
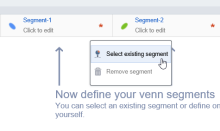
If you wish to change the selected table, click on the field again and use the same method to select the required option. Define SegmentsInitially two Segments are displayed, Segment-1 and Segment-2. There are two options for setting up a Segment:
Select Existing SegmentSelect an existing Segment Document from the Segment Library to the define the Segment. On a Segment, click the ellipses button and choose the Select existing segment option from the pop up menu:
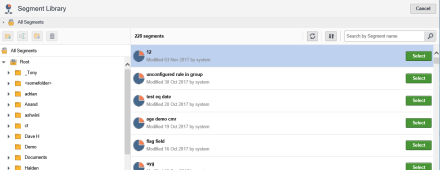
This will open the Segment Library screen:
Navigate to the required folder and choose the Segment you wish to use. Click the Select button. This will copy the Segment to the Insights screen:
If required you can click on the Segment and make any changes needed.
If you choose to select another existing Segment, it will overwrite the current one. Manually Define a SegmentFor new Segments, select the pencil icon or for editing an existing segment, click on the Segment to open the edit screen. Again note that the top level table of resolution, as seen below on the "Applies to Household" label, has inherited the selection of the Measure table and cannot be edited here.
NameThe Segment name can be edited from the default value or where an existing Segment Document has been chosen, the name of the original. Rules and GroupsManually create Groups and Rules to define the Segment. This functionality is the same as that used in Segment Builder, see Adding Rules or Adding Groups in the Segment Builder section for more detail. Segment ValidationIf a Segment does not have a valid definition, it will remain gray with a 'Click to edit' message displayed. Once a Segment has a valid definition, it will turn white:
Add More SegmentsIt is possible to add further Segments up to a maximum of 6.
To add another Segment, click the This will create another Segment field:
This Segment can be defined and edited as described above.
Remove SegmentsAny Segments that have been added above the minimum required number of 2, can be removed if required. Hover over the Segment and click the ellipses button, select the Remove Segment option from the pop up menu:
This will delete the Segment from the Insights screen. The color icons for each Segment may change dependent on the position of the Segment that was deleted. FilterIf required, you can apply a filter across the whole Insight and all its Segments for more targeted results. Click on the Filter icon
Add Rules or Groups to the screen to define the Filter, this functionality is as described for Segments. Once the Filter is defined, click the Done button to save. Calculate the VennOnce the Measure has been set and all Segments are defined, the Venn can be calculated. Click the Update Counts button on the main toolbar:
This will calculate and display the Venn. View Results
Once a Venn Insight has been calculated, the resulting Venn diagram and grid will be displayed:
2 Segment Venn shown The Venn diagram on the left, shows the Segments and Intersection with the relevant counts.
The Grid on the right, shows the information in table form with the counts and the relevant percentages for each Segment and Intersection shown in the diagram. The first column shows the color and shape of each area of the Venn followed by:
For the Segment columns, the following icons are used:
Where more Segments are included, the Venn becomes more complex with not only the extra Segments but with more Intersections:
If any changes are made to the Insight e.g. Measure or Segments are changed, the results will become opaque, this means that the counts shown are now invalid. Recalculate the counts by clicking the Update Counts button on the toolbar. Extract a Venn Section as a SegmentIt is possible to export a section of the Venn as a segment and save it to the Segment Library, See Export Sections From Venn as Segments for more information. Optional - Save /Save AsSaveTo save the Venn, click the Save icon on the main toolbar.
This will open the Save window, navigate to the folder location in which you wish to save the Venn, enter a name for the Venn, an optional description and click the Save button. When a saved Venn is opened, the Venn Diagram and Grid will not be displayed and the Venn will need to be calculated again by clicking the Update Counts button. Save AsAn existing saved Venn can be saved under another name, click the down arrow under the Save button on the main toolbar and selecting the Save As option from the drop down menu:
This will open a the Save As window, navigate to the folder location in which you wish to save the Venn, enter a new name for the Venn, an optional description and click the Save button. When a saved Venn is opened, the Venn Diagram and Grid will not be displayed and the Venn will need to be calculated again by clicking the Update Counts button. |


 button can be used to navigate back up through the data structure levels if required:


 icon
icon

 on the toolbar, this will open the Filter screen:


 - Records from the Segment are included in the area.
 - Records from the Segment are not included in the area.


|
© Alterian. All Rights Reserved. | Privacy Policy | Legal Notice |   |